
 Search
 Feedback
 About
About Help
Help News
News
| Listing 1 - 1 of 1 |
Sort by
|
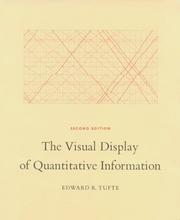
ISBN: 0961392142 9780961392147 Year: 2006 Publisher: Cheshire Graphics Press
Abstract | Keywords | Export | Availability | Bookmark
 Loading...
Choose an application
- Reference Manager
- EndNote
- RefWorks (Direct export to RefWorks)
The classic book on statistical graphics, charts, tables. Theory and practice in the design of data graphics, 250 illustrations of the best (and a few of the worst) statistical graphics, with detailed analysis of how to display data for precise, effective, quick analysis. Design of the high-resolution displays, small multiples. Editing and improving graphics. The data-ink ratio. Time-series, relational graphics, data maps, multivariate designs. Detection of graphical deception: design variation vs. data variation. Sources of deception. Aesthetics and data graphical displays. This is the second edition of The Visual Display of Quantitative Information. Recently published, this new edition provides excellent color reproductions of the many graphics of William Playfair, adds color to other images, and includes all the changes and corrections accumulated during 17 printings of the first edition.
Analyse des données --- Communication visuelle --- Graphes --- Représentation graphique --- Statistique --- Theorie des trames --- Statistics --- Graphic methods --- Graphic methods. --- Graphics industry --- Graphic signs --- Graphic arts --- Statistical science --- Mathematical statistics --- 001.4226 --- 028 --- 302 --- 338.755.2 --- AA / International- internationaal --- 007 --- 31 --- 655 --- 7.012 --- 766 --- 681.3*H52 --- 681.3*I6 --- 681.3*H52 Information interfaces and presentation: user interfaces, input devices, input strategies, user interface management systems --- Information interfaces and presentation: user interfaces, input devices, input strategies, user interface management systems --- 681.3*I6 Simulation and modeling (Computing methodologies)--See also {681.3*G3} --- Simulation and modeling (Computing methodologies)--See also {681.3*G3} --- Diagrams, Statistical --- Statistical diagrams --- Curve fitting --- Lectuur. Adviezen voor de lezers. Snel lezen --- Opmaak en presentatie van statistische reeksen en tabellen. Grafieken --- Drukkerij en uitgeverij --- Communicatie --- Visuele communicatie --- Statistiek --- Statistieken --- Grafische industrie --- Ontwerp (kunst) --- Gebruiksgrafiek --- Grafische vormgeving --- Méthodes graphiques --- 655.26 --- computergrafiek --- webdesign --- grafische vormgeving --- grafisch design --- grafisch ontwerp --- tabellen --- grafieken --- informatiedesign --- 766.022 --- grafische vormgeving, typografie --- Informatie --- Informatieverschaffing --- Statistische gegevens --- Beeldvorming --- 766:659.2 --- Grafieken ; statistieken --- Grafische vormgeving ; visualisering kwantitatieve informatie --- Gebruiksgrafiek ; voorlichting ; adviezen --- Monograph --- Sport --- Statistics - Graphic methods --- 766.32.044 --- Grafische industrie en ontwerp ; beeld ; illustratie ; thema's ; infographics
| Listing 1 - 1 of 1 |
Sort by
|